Hello,
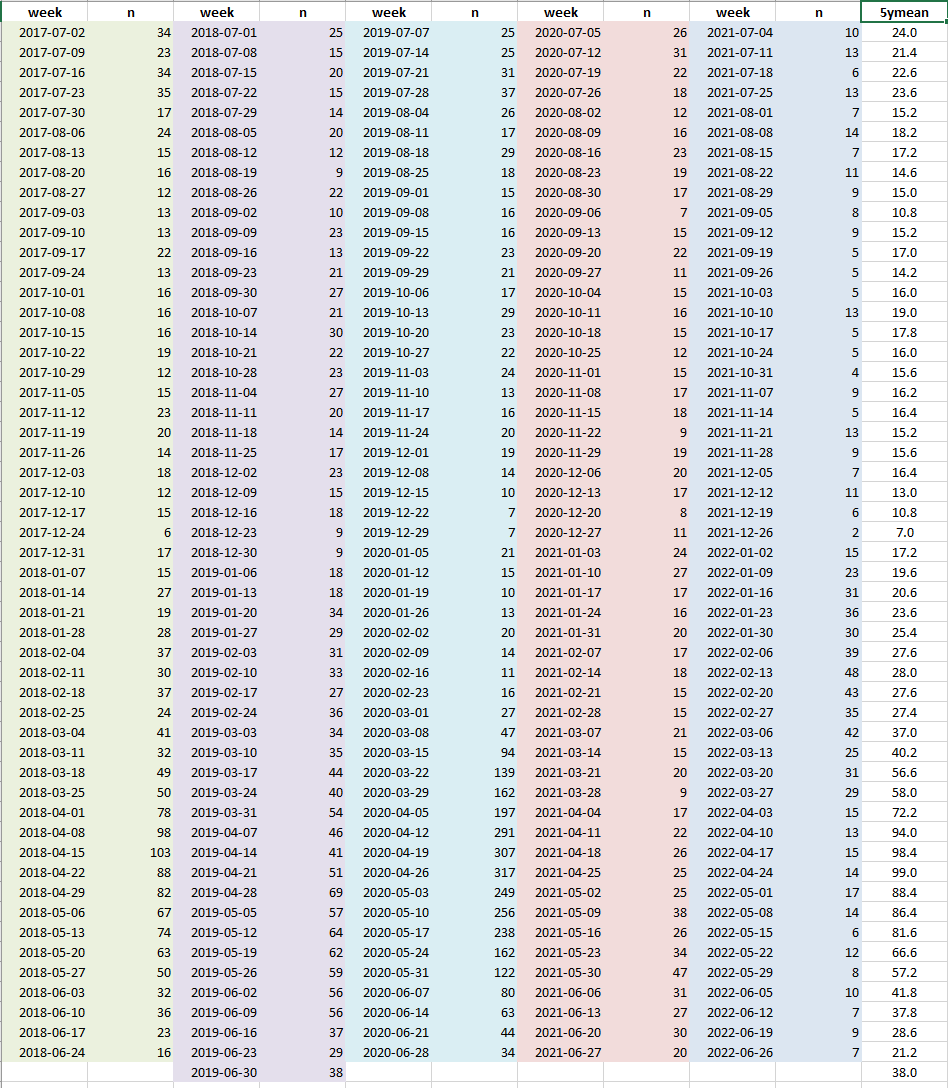
You can certainly achieve a 5-year rolling average using the slider package, here is an example:
# loading packages

library(dplyr)
#>
#> Attaching package: 'dplyr'
#> The following objects are masked from 'package:stats':
#>
#>     filter, lag
#> The following objects are masked from 'package:base':
#>
#>     intersect, setdiff, setequal, union
library(tibble)
library(slider)
library(gt)

# simulating data
simulated_data <- tibble(year = seq.int(from = 2005L, to = 2023L, by = 1L)) |>
    rowwise() |>
    mutate(n = rpois(n = 1, lambda = 150)) |>
    ungroup()

# deriving rolling average
threshold_data <- simulated_data |>
    mutate(rolling_average = slide_dbl(.x = n, .f = mean, .before = 5L, .after = -1L, .step = 1L, .complete = TRUE),
                 rolling_sd = slide_dbl(.x = n, .f = sd, .before = 5L, .after = -1L, .step = 1L, .complete = TRUE),
                 threshold = rolling_average + qnorm(p = (1 - 0.05), mean = 0, sd = 1) * rolling_sd,
                 alert = n > threshold)

gt(data = threshold_data) |>
    cols_label(
        year = "Year",
        n = "Count",
        rolling_average = "5-year rolling average",
        rolling_sd = "5-year rolling standard deviation",
        threshold = "Threshold",
        alert = "Alert"
    )
#htzaxehkbm table {
font-family: system-ui, 'Segoe UI', Roboto, Helvetica, Arial, sans-serif, 'Apple Color Emoji', 'Segoe UI Emoji', 'Segoe UI Symbol', 'Noto Color Emoji';
-webkit-font-smoothing: antialiased;
-moz-osx-font-smoothing: grayscale;
}
#htzaxehkbm thead, #htzaxehkbm tbody, #htzaxehkbm tfoot, #htzaxehkbm tr, #htzaxehkbm td, #htzaxehkbm th {
border-style: none;
}
#htzaxehkbm p {
margin: 0;
padding: 0;
}
#htzaxehkbm .gt_table {
display: table;
border-collapse: collapse;
line-height: normal;
margin-left: auto;
margin-right: auto;
color: #333333;
font-size: 16px;
font-weight: normal;
font-style: normal;
background-color: #FFFFFF;
width: auto;
border-top-style: solid;
border-top-width: 2px;
border-top-color: #A8A8A8;
border-right-style: none;
border-right-width: 2px;
border-right-color: #D3D3D3;
border-bottom-style: solid;
border-bottom-width: 2px;
border-bottom-color: #A8A8A8;
border-left-style: none;
border-left-width: 2px;
border-left-color: #D3D3D3;
}
#htzaxehkbm .gt_caption {
padding-top: 4px;
padding-bottom: 4px;
}
#htzaxehkbm .gt_title {
color: #333333;
font-size: 125%;
font-weight: initial;
padding-top: 4px;
padding-bottom: 4px;
padding-left: 5px;
padding-right: 5px;
border-bottom-color: #FFFFFF;
border-bottom-width: 0;
}
#htzaxehkbm .gt_subtitle {
color: #333333;
font-size: 85%;
font-weight: initial;
padding-top: 3px;
padding-bottom: 5px;
padding-left: 5px;
padding-right: 5px;
border-top-color: #FFFFFF;
border-top-width: 0;
}
#htzaxehkbm .gt_heading {
background-color: #FFFFFF;
text-align: center;
border-bottom-color: #FFFFFF;
border-left-style: none;
border-left-width: 1px;
border-left-color: #D3D3D3;
border-right-style: none;
border-right-width: 1px;
border-right-color: #D3D3D3;
}
#htzaxehkbm .gt_bottom_border {
border-bottom-style: solid;
border-bottom-width: 2px;
border-bottom-color: #D3D3D3;
}
#htzaxehkbm .gt_col_headings {
border-top-style: solid;
border-top-width: 2px;
border-top-color: #D3D3D3;
border-bottom-style: solid;
border-bottom-width: 2px;
border-bottom-color: #D3D3D3;
border-left-style: none;
border-left-width: 1px;
border-left-color: #D3D3D3;
border-right-style: none;
border-right-width: 1px;
border-right-color: #D3D3D3;
}
#htzaxehkbm .gt_col_heading {
color: #333333;
background-color: #FFFFFF;
font-size: 100%;
font-weight: normal;
text-transform: inherit;
border-left-style: none;
border-left-width: 1px;
border-left-color: #D3D3D3;
border-right-style: none;
border-right-width: 1px;
border-right-color: #D3D3D3;
vertical-align: bottom;
padding-top: 5px;
padding-bottom: 6px;
padding-left: 5px;
padding-right: 5px;
overflow-x: hidden;
}
#htzaxehkbm .gt_column_spanner_outer {
color: #333333;
background-color: #FFFFFF;
font-size: 100%;
font-weight: normal;
text-transform: inherit;
padding-top: 0;
padding-bottom: 0;
padding-left: 4px;
padding-right: 4px;
}
#htzaxehkbm .gt_column_spanner_outer:first-child {
padding-left: 0;
}
#htzaxehkbm .gt_column_spanner_outer:last-child {
padding-right: 0;
}
#htzaxehkbm .gt_column_spanner {
border-bottom-style: solid;
border-bottom-width: 2px;
border-bottom-color: #D3D3D3;
vertical-align: bottom;
padding-top: 5px;
padding-bottom: 5px;
overflow-x: hidden;
display: inline-block;
width: 100%;
}
#htzaxehkbm .gt_spanner_row {
border-bottom-style: hidden;
}
#htzaxehkbm .gt_group_heading {
padding-top: 8px;
padding-bottom: 8px;
padding-left: 5px;
padding-right: 5px;
color: #333333;
background-color: #FFFFFF;
font-size: 100%;
font-weight: initial;
text-transform: inherit;
border-top-style: solid;
border-top-width: 2px;
border-top-color: #D3D3D3;
border-bottom-style: solid;
border-bottom-width: 2px;
border-bottom-color: #D3D3D3;
border-left-style: none;
border-left-width: 1px;
border-left-color: #D3D3D3;
border-right-style: none;
border-right-width: 1px;
border-right-color: #D3D3D3;
vertical-align: middle;
text-align: left;
}
#htzaxehkbm .gt_empty_group_heading {
padding: 0.5px;
color: #333333;
background-color: #FFFFFF;
font-size: 100%;
font-weight: initial;
border-top-style: solid;
border-top-width: 2px;
border-top-color: #D3D3D3;
border-bottom-style: solid;
border-bottom-width: 2px;
border-bottom-color: #D3D3D3;
vertical-align: middle;
}
#htzaxehkbm .gt_from_md > :first-child {
margin-top: 0;
}
#htzaxehkbm .gt_from_md > :last-child {
margin-bottom: 0;
}
#htzaxehkbm .gt_row {
padding-top: 8px;
padding-bottom: 8px;
padding-left: 5px;
padding-right: 5px;
margin: 10px;
border-top-style: solid;
border-top-width: 1px;
border-top-color: #D3D3D3;
border-left-style: none;
border-left-width: 1px;
border-left-color: #D3D3D3;
border-right-style: none;
border-right-width: 1px;
border-right-color: #D3D3D3;
vertical-align: middle;
overflow-x: hidden;
}
#htzaxehkbm .gt_stub {
color: #333333;
background-color: #FFFFFF;
font-size: 100%;
font-weight: initial;
text-transform: inherit;
border-right-style: solid;
border-right-width: 2px;
border-right-color: #D3D3D3;
padding-left: 5px;
padding-right: 5px;
}
#htzaxehkbm .gt_stub_row_group {
color: #333333;
background-color: #FFFFFF;
font-size: 100%;
font-weight: initial;
text-transform: inherit;
border-right-style: solid;
border-right-width: 2px;
border-right-color: #D3D3D3;
padding-left: 5px;
padding-right: 5px;
vertical-align: top;
}
#htzaxehkbm .gt_row_group_first td {
border-top-width: 2px;
}
#htzaxehkbm .gt_row_group_first th {
border-top-width: 2px;
}
#htzaxehkbm .gt_summary_row {
color: #333333;
background-color: #FFFFFF;
text-transform: inherit;
padding-top: 8px;
padding-bottom: 8px;
padding-left: 5px;
padding-right: 5px;
}
#htzaxehkbm .gt_first_summary_row {
border-top-style: solid;
border-top-color: #D3D3D3;
}
#htzaxehkbm .gt_first_summary_row.thick {
border-top-width: 2px;
}
#htzaxehkbm .gt_last_summary_row {
padding-top: 8px;
padding-bottom: 8px;
padding-left: 5px;
padding-right: 5px;
border-bottom-style: solid;
border-bottom-width: 2px;
border-bottom-color: #D3D3D3;
}
#htzaxehkbm .gt_grand_summary_row {
color: #333333;
background-color: #FFFFFF;
text-transform: inherit;
padding-top: 8px;
padding-bottom: 8px;
padding-left: 5px;
padding-right: 5px;
}
#htzaxehkbm .gt_first_grand_summary_row {
padding-top: 8px;
padding-bottom: 8px;
padding-left: 5px;
padding-right: 5px;
border-top-style: double;
border-top-width: 6px;
border-top-color: #D3D3D3;
}
#htzaxehkbm .gt_last_grand_summary_row_top {
padding-top: 8px;
padding-bottom: 8px;
padding-left: 5px;
padding-right: 5px;
border-bottom-style: double;
border-bottom-width: 6px;
border-bottom-color: #D3D3D3;
}
#htzaxehkbm .gt_striped {
background-color: rgba(128, 128, 128, 0.05);
}
#htzaxehkbm .gt_table_body {
border-top-style: solid;
border-top-width: 2px;
border-top-color: #D3D3D3;
border-bottom-style: solid;
border-bottom-width: 2px;
border-bottom-color: #D3D3D3;
}
#htzaxehkbm .gt_footnotes {
color: #333333;
background-color: #FFFFFF;
border-bottom-style: none;
border-bottom-width: 2px;
border-bottom-color: #D3D3D3;
border-left-style: none;
border-left-width: 2px;
border-left-color: #D3D3D3;
border-right-style: none;
border-right-width: 2px;
border-right-color: #D3D3D3;
}
#htzaxehkbm .gt_footnote {
margin: 0px;
font-size: 90%;
padding-top: 4px;
padding-bottom: 4px;
padding-left: 5px;
padding-right: 5px;
}
#htzaxehkbm .gt_sourcenotes {
color: #333333;
background-color: #FFFFFF;
border-bottom-style: none;
border-bottom-width: 2px;
border-bottom-color: #D3D3D3;
border-left-style: none;
border-left-width: 2px;
border-left-color: #D3D3D3;
border-right-style: none;
border-right-width: 2px;
border-right-color: #D3D3D3;
}
#htzaxehkbm .gt_sourcenote {
font-size: 90%;
padding-top: 4px;
padding-bottom: 4px;
padding-left: 5px;
padding-right: 5px;
}
#htzaxehkbm .gt_left {
text-align: left;
}
#htzaxehkbm .gt_center {
text-align: center;
}
#htzaxehkbm .gt_right {
text-align: right;
font-variant-numeric: tabular-nums;
}
#htzaxehkbm .gt_font_normal {
font-weight: normal;
}
#htzaxehkbm .gt_font_bold {
font-weight: bold;
}
#htzaxehkbm .gt_font_italic {
font-style: italic;
}
#htzaxehkbm .gt_super {
font-size: 65%;
}
#htzaxehkbm .gt_footnote_marks {
font-size: 75%;
vertical-align: 0.4em;
position: initial;
}
#htzaxehkbm .gt_asterisk {
font-size: 100%;
vertical-align: 0;
}
#htzaxehkbm .gt_indent_1 {
text-indent: 5px;
}
#htzaxehkbm .gt_indent_2 {
text-indent: 10px;
}
#htzaxehkbm .gt_indent_3 {
text-indent: 15px;
}
#htzaxehkbm .gt_indent_4 {
text-indent: 20px;
}
#htzaxehkbm .gt_indent_5 {
text-indent: 25px;
}
| Year |
Count |
5-year rolling average |
5-year rolling standard deviation |
Threshold |
Alert |
| 2005 |
159 |
NA |
NA |
NA |
NA |
| 2006 |
151 |
NA |
NA |
NA |
NA |
| 2007 |
170 |
NA |
NA |
NA |
NA |
| 2008 |
128 |
NA |
NA |
NA |
NA |
| 2009 |
147 |
NA |
NA |
NA |
NA |
| 2010 |
161 |
151.0 |
15.572412 |
176.6143 |
FALSE |
| 2011 |
147 |
151.4 |
15.852445 |
177.4750 |
FALSE |
| 2012 |
156 |
150.6 |
15.978110 |
176.8817 |
FALSE |
| 2013 |
148 |
147.8 |
12.597619 |
168.5212 |
FALSE |
| 2014 |
136 |
151.8 |
6.379655 |
162.2936 |
FALSE |
| 2015 |
161 |
149.6 |
9.555103 |
165.3167 |
FALSE |
| 2016 |
168 |
149.6 |
9.555103 |
165.3167 |
TRUE |
| 2017 |
141 |
153.8 |
12.336936 |
174.0925 |
FALSE |
| 2018 |
146 |
150.8 |
13.442470 |
172.9109 |
FALSE |
| 2019 |
129 |
150.4 |
13.575714 |
172.7301 |
FALSE |
| 2020 |
147 |
149.0 |
15.636496 |
174.7197 |
FALSE |
| 2021 |
149 |
146.2 |
14.131525 |
169.4443 |
FALSE |
| 2022 |
147 |
142.4 |
8.049845 |
155.6408 |
FALSE |
| 2023 |
163 |
143.6 |
8.234076 |
157.1438 |
TRUE |
Created on 2023-08-04 with reprex v2.0.2
Session info
sessionInfo()
#> R version 4.3.1 (2023-06-16)
#> Platform: x86_64-apple-darwin20 (64-bit)
#> Running under: macOS Ventura 13.5
#>
#> Matrix products: default
#> BLAS:   /Library/Frameworks/R.framework/Versions/4.3-x86_64/Resources/lib/libRblas.0.dylib
#> LAPACK: /Library/Frameworks/R.framework/Versions/4.3-x86_64/Resources/lib/libRlapack.dylib;  LAPACK version 3.11.0
#>
#> locale:
#> [1] en_US.UTF-8/en_US.UTF-8/en_US.UTF-8/C/en_US.UTF-8/en_US.UTF-8
#>
#> time zone: America/Toronto
#> tzcode source: internal
#>
#> attached base packages:
#> [1] stats     graphics  grDevices utils     datasets  methods   base
#>
#> other attached packages:
#> [1] gt_0.9.0     slider_0.3.0 tibble_3.2.1 dplyr_1.1.2
#>
#> loaded via a namespace (and not attached):
#>  [1] vctrs_0.6.3       cli_3.6.1         knitr_1.43        rlang_1.1.1
#>  [5] xfun_0.39         purrr_1.0.1       styler_1.10.1     generics_0.1.3
#>  [9] glue_1.6.2        htmltools_0.5.5   sass_0.4.7        fansi_1.0.4
#> [13] rmarkdown_2.23    R.cache_0.16.0    evaluate_0.21     fastmap_1.1.1
#> [17] yaml_2.3.7        lifecycle_1.0.3   compiler_4.3.1    fs_1.6.3
#> [21] pkgconfig_2.0.3   rstudioapi_0.15.0 R.oo_1.25.0       R.utils_2.12.2
#> [25] digest_0.6.33     R6_2.5.1          tidyselect_1.2.0  utf8_1.2.3
#> [29] reprex_2.0.2      pillar_1.9.0      magrittr_2.0.3    R.methodsS3_1.8.2
#> [33] tools_4.3.1       withr_2.5.0       warp_0.2.0        xml2_1.3.5
All the best,
Tim
