Need help re-organizing a table

Hello, thanks in advance for your help! New R user, I’ve tried reading the websites for tbl_summary, tabyl, handbook, and other online forums but haven’t found an answer.

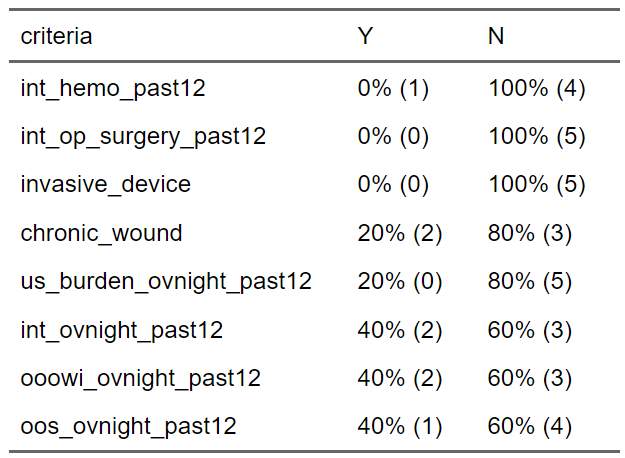
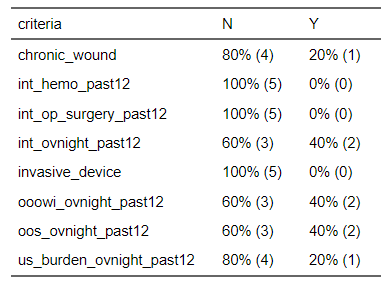
I have created a table of screening criteria and cases who meet them. I want to be able to arrange both columns and rows differently. I would like the “Yes” column to appear to the left of the “No” column. I’d also like to arrange the rows in order from fewest % Yes to greatest % Yes. I’m hoping to finish this up in the next week or so, but it is not urgent. Output & Reprex below!

image

# Reprex of screening criteria table 


# Load packages -----------------------------------------------------------
pacman::p_load(
  rio,          # for importing data
  here,         # for locating files
  skimr,        # for reviewing the data
  janitor,      # for data cleaning  
  officer,      # border lines
  epikit,       # creating age categories
  gtsummary,    # creating tables  
  RColorBrewer, # for color palettes
  viridis,      # for more color palettes
  scales,       # percents in tables  
  flextable,    # for making pretty tables
  officer,      # helper functions for nice tables
  tidyverse,    # for data management and visualization
  reprex,
  datapasta
)

# Import data -------------------------------------------------------------

# import case data
review_raw <- data.frame(
  stringsAsFactors = FALSE,
  oos_ovnight_past12 = c("Y", "N", "N", "N", "Y"),
  int_hemo_past12 = c("N", "N", "N", "N", "N"),
  int_op_surgery_past12 = c("N", "N", "N", "N", "N"),
  ooowi_ovnight_past12 = c("Y", "N", "N", "N", "Y"),
  int_ovnight_past12 = c("Y", "N", "N", "N", "Y"),
  us_burden_ovnight_past12 = c("Y", "N", "N", "N", "N"),
  invasive_device = c("N", "N", "N", "N", "N"),
  chronic_wound = c("Y", "N", "N", "N", "N")
)


# Screening criteria ------------------------------------------------------

# create a new data frame by pivoting the screening criteria
criteria_long <- review_raw %>%
  # select columns to include
  select(oos_ovnight_past12:chronic_wound) %>%
  # select columns to pivot, : selects range between these two variables
  pivot_longer(cols = oos_ovnight_past12:chronic_wound) 

# create a facor of screening criteria
criteria_factor <- criteria_long %>%
  # sort by name of criteria 
  arrange(name, value) %>%
  # attempting to somehow re-order the criteria names, but it doesn't work?
  mutate(criteria = factor(name, unique(name)))


# use newly created data frame
criteria_factor %>%
  # create a table
  tabyl(criteria,value) %>%
  # display percentages
  adorn_percentages() %>%
  # format percentages to whole numbers
  adorn_pct_formatting(digits = 0) %>%
  # add n values after percentages
  adorn_ns("rear") %>%
  qflextable()

[image]

Created on 2024-05-20 with reprex v2.1.0

Session info

#> R version 4.3.3 (2024-02-29 ucrt)
#> Platform: x86_64-w64-mingw32/x64 (64-bit)
#> Running under: Windows 10 x64 (build 19044)

1 Like

Hi @evelynldonahoe,

Thanks for your post and reprex! It made working with your problem quite straight forward.
Does the below work for you?

You can use two tidyverse functions on the data frame to achieve what you want. The key is where in the pipe chain to place them.

  • You can use select() to rearrange the columns. This must be done before qflextable()
  • You can use arrange() to sort the rows (ascending is default, use desc() or a - symbol within arrange() if you want the opposite) This must be done before the % symbol is introduced, which converts the values to character instead of numeric.

Please double check nothing strange has happened with the values.
Hope this helps!
Neale

# Load packages -----------------------------------------------------------
pacman::p_load(
  rio,          # for importing data
  here,         # for locating files
  skimr,        # for reviewing the data
  janitor,      # for data cleaning  
  officer,      # border lines
  epikit,       # creating age categories
  gtsummary,    # creating tables  
  RColorBrewer, # for color palettes
  viridis,      # for more color palettes
  scales,       # percents in tables  
  flextable,    # for making pretty tables
  officer,      # helper functions for nice tables
  tidyverse,    # for data management and visualization
  reprex,
  datapasta
)

# Import data -------------------------------------------------------------

# import case data
review_raw <- data.frame(
  stringsAsFactors = FALSE,
  oos_ovnight_past12 = c("Y", "N", "N", "N", "Y"),
  int_hemo_past12 = c("N", "N", "N", "N", "N"),
  int_op_surgery_past12 = c("N", "N", "N", "N", "N"),
  ooowi_ovnight_past12 = c("Y", "N", "N", "N", "Y"),
  int_ovnight_past12 = c("Y", "N", "N", "N", "Y"),
  us_burden_ovnight_past12 = c("Y", "N", "N", "N", "N"),
  invasive_device = c("N", "N", "N", "N", "N"),
  chronic_wound = c("Y", "N", "N", "N", "N")
)


# Screening criteria ------------------------------------------------------

# create a new data frame by pivoting the screening criteria
criteria_long <- review_raw %>%
  # select columns to include
  select(oos_ovnight_past12:chronic_wound) %>%
  # select columns to pivot, : selects range between these two variables
  pivot_longer(cols = oos_ovnight_past12:chronic_wound) 

# create a facor of screening criteria
criteria_factor <- criteria_long %>%
  # sort by name of criteria 
  arrange(name, value) %>%
  # attempting to somehow re-order the criteria names, but it doesn't work?
  mutate(criteria = factor(name, unique(name)))


# use newly created data frame
criteria_factor %>%
  # create a table
  tabyl(criteria,value) %>%
  # display percentages
  adorn_percentages() %>%
  # order rows ascending on Y, before the % symbols are introduced (while still numeric)
  arrange(Y) %>% 
  # format percentages to whole numbers
  adorn_pct_formatting(digits = 0) %>%
  # add n values after percentages
  adorn_ns("rear") %>%
  #re-arrange columns before converting to flextable
  select(criteria, Y, N) %>% 
  qflextable()

image

Created on 2024-05-21 with reprex v2.0.2

1 Like

Thank you so much! This worked perfectly.

1 Like