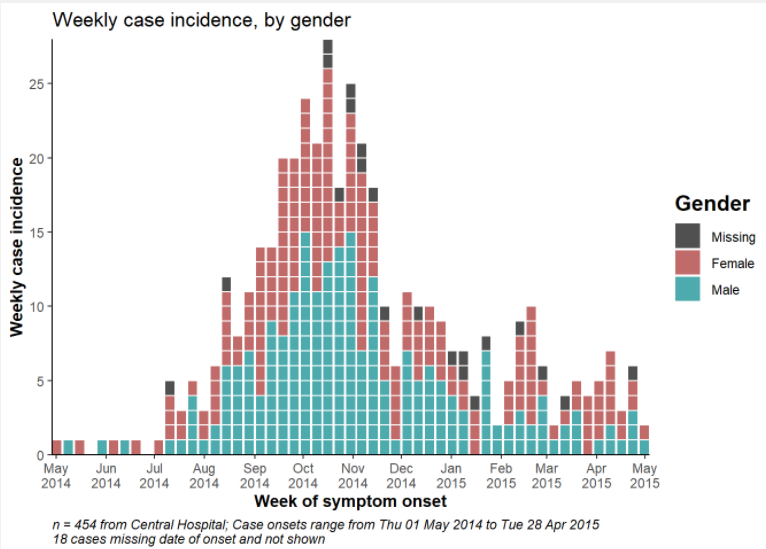
Does anyone know how to enable show cases in ggplot histogram like the one from the picture (in Epi R handbook there is only a picture without code)?
1 Like
The code can be found in this Github post. it is not yet in the Epi R Handbook itself and has not been tested in quite a while.
Good luck!
2 Likes
Thanks a lot! I will figure out how to edit it according to my needs. ![]()
1 Like