Fixing "year" in dataset so R recognizes it as "year" and not as "numeric

Thank you for posting! Here is an outline of an effective post:

I need to convert the year column in my data set to “year” eg 2000 however, R recognizes this column as numeric.

Secondly, I need to use this to plot trends for a number of countries. Any suggestions will be appreciated. Thanks

What steps have you already taken to find an answer?

Provide an example of your R code

Follow-up

  • Thank the volunteers who try to help you
  • Mark one reply as the “Solution” if appropriate
1 Like

Hi @mabelaworh , thank you for posting!

In R, a date must consist of a year, month, and day. A single number like 2000 cannot be converted to Date. If you change the years to “2020-01-01”, then they can be handled like a date (1 Jan 2020).

It is possible that you do not actually need the years as dates - you provide more information about what plot you are trying to make, or some of your R code, then it may be easier for us to help.

To quickly convert years alone (e.g. 2020) to dates (as 2020-01-01) you could write code like this:

data <- data %>%
    mutate(year = as.Date(str_glue({year}-01-01))

Below I have provided an example of applying this code to a numeric year column.
Let us know if this helps!
Neale

#load packages
library(tidyverse)

# make example data
data <- tribble(
  ~year,
  2020,
  2020,
  2020,
  2021,
  2021,
  2021,
  2021
)

# view example data
data
#> # A tibble: 7 × 1
#>    year
#>   <dbl>
#> 1  2020
#> 2  2020
#> 3  2020
#> 4  2021
#> 5  2021
#> 6  2021
#> 7  2021

# check class of year column
class(data$year)
#> [1] "numeric"

# change class to Date by adding "-01-01" after the year
data <- data %>%
  mutate(year_dt = as.Date(str_glue("{year}-01-01")))

# check class of new date column
class(data$year_dt)
#> [1] "Date"

# look at data
data
#> # A tibble: 7 × 2
#>    year year_dt   
#>   <dbl> <date>    
#> 1  2020 2020-01-01
#> 2  2020 2020-01-01
#> 3  2020 2020-01-01
#> 4  2021 2021-01-01
#> 5  2021 2021-01-01
#> 6  2021 2021-01-01
#> 7  2021 2021-01-01

Created on 2023-06-19 with reprex v2.0.2

Session info
sessioninfo::session_info()
#> ─ Session info ───────────────────────────────────────────────────────────────
#>  setting  value
#>  version  R version 4.3.0 (2023-04-21 ucrt)
#>  os       Windows 11 x64 (build 22621)
#>  system   x86_64, mingw32
#>  ui       RTerm
#>  language (EN)
#>  collate  English_United States.utf8
#>  ctype    English_United States.utf8
#>  tz       Europe/Berlin
#>  date     2023-06-19
#>  pandoc   2.19.2 @ C:/Program Files/RStudio/resources/app/bin/quarto/bin/tools/ (via rmarkdown)
#> 
#> ─ Packages ───────────────────────────────────────────────────────────────────
#>  package     * version date (UTC) lib source
#>  cli           3.6.1   2023-03-23 [1] CRAN (R 4.3.0)
#>  colorspace    2.1-0   2023-01-23 [1] CRAN (R 4.3.0)
#>  digest        0.6.31  2022-12-11 [1] CRAN (R 4.3.0)
#>  dplyr       * 1.1.2   2023-04-20 [1] CRAN (R 4.3.0)
#>  evaluate      0.21    2023-05-05 [1] CRAN (R 4.3.0)
#>  fansi         1.0.4   2023-01-22 [1] CRAN (R 4.3.0)
#>  fastmap       1.1.1   2023-02-24 [1] CRAN (R 4.3.0)
#>  forcats     * 1.0.0   2023-01-29 [1] CRAN (R 4.3.0)
#>  fs            1.6.2   2023-04-25 [1] CRAN (R 4.3.0)
#>  generics      0.1.3   2022-07-05 [1] CRAN (R 4.3.0)
#>  ggplot2     * 3.4.2   2023-04-03 [1] CRAN (R 4.3.0)
#>  glue          1.6.2   2022-02-24 [1] CRAN (R 4.3.0)
#>  gtable        0.3.3   2023-03-21 [1] CRAN (R 4.3.0)
#>  hms           1.1.3   2023-03-21 [1] CRAN (R 4.3.0)
#>  htmltools     0.5.5   2023-03-23 [1] CRAN (R 4.3.0)
#>  knitr         1.42    2023-01-25 [1] CRAN (R 4.3.0)
#>  lifecycle     1.0.3   2022-10-07 [1] CRAN (R 4.3.0)
#>  lubridate   * 1.9.2   2023-02-10 [1] CRAN (R 4.3.0)
#>  magrittr      2.0.3   2022-03-30 [1] CRAN (R 4.3.0)
#>  munsell       0.5.0   2018-06-12 [1] CRAN (R 4.3.0)
#>  pillar        1.9.0   2023-03-22 [1] CRAN (R 4.3.0)
#>  pkgconfig     2.0.3   2019-09-22 [1] CRAN (R 4.3.0)
#>  purrr       * 1.0.1   2023-01-10 [1] CRAN (R 4.3.0)
#>  R6            2.5.1   2021-08-19 [1] CRAN (R 4.3.0)
#>  readr       * 2.1.4   2023-02-10 [1] CRAN (R 4.3.0)
#>  reprex        2.0.2   2022-08-17 [1] CRAN (R 4.3.0)
#>  rlang         1.1.1   2023-04-28 [1] CRAN (R 4.3.0)
#>  rmarkdown     2.21    2023-03-26 [1] CRAN (R 4.3.0)
#>  rstudioapi    0.14    2022-08-22 [1] CRAN (R 4.3.0)
#>  scales        1.2.1   2022-08-20 [1] CRAN (R 4.3.0)
#>  sessioninfo   1.2.2   2021-12-06 [1] CRAN (R 4.3.0)
#>  stringi       1.7.12  2023-01-11 [1] CRAN (R 4.3.0)
#>  stringr     * 1.5.0   2022-12-02 [1] CRAN (R 4.3.0)
#>  tibble      * 3.2.1   2023-03-20 [1] CRAN (R 4.3.0)
#>  tidyr       * 1.3.0   2023-01-24 [1] CRAN (R 4.3.0)
#>  tidyselect    1.2.0   2022-10-10 [1] CRAN (R 4.3.0)
#>  tidyverse   * 2.0.0   2023-02-22 [1] CRAN (R 4.3.0)
#>  timechange    0.2.0   2023-01-11 [1] CRAN (R 4.3.0)
#>  tzdb          0.4.0   2023-05-12 [1] CRAN (R 4.3.0)
#>  utf8          1.2.3   2023-01-31 [1] CRAN (R 4.3.0)
#>  vctrs         0.6.2   2023-04-19 [1] CRAN (R 4.3.0)
#>  withr         2.5.0   2022-03-03 [1] CRAN (R 4.3.0)
#>  xfun          0.39    2023-04-20 [1] CRAN (R 4.3.0)
#>  yaml          2.3.7   2023-01-23 [1] CRAN (R 4.3.0)
#> 
#>  [1] C:/Users/neale/AppData/Local/R/win-library/4.3
#>  [2] C:/Program Files/R/R-4.3.0/library
#> 
#> ──────────────────────────────────────────────────────────────────────────────

Neale

1 Like

Thanks Neale,

I wanted to plot a line graph showing trends of pathogens from 2002 to 2021.

Not sure how to do this so I thought year needs to be a date to make this happen. Any thoughts will be appreciated.

my codes did not work. The year column varies from 2002 - 2021

ggplot (Species, aes (year, percentages, colour = phenotype)) +
geom_line

Hi @mabelaworh

It sounds like the solution could be simple. Were you able to try converting the years to dates with the code I provided above?

If you can provide a small piece of your data and the complete R code, then maybe we see the problem can help you to troubleshoot. See this video for guidance on how to do this.

Best,
Neale

Good afternoon,

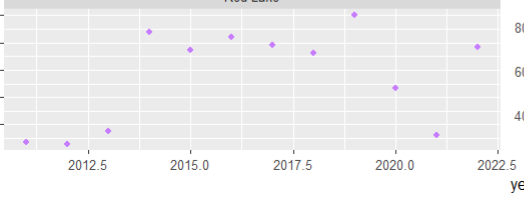
I believe, I am running into a similar issue. I’ve tried to find an example of what I am trying to do but have not had much luck. My problem is two fold, but the first issue shouldn’t be to difficult to figure out, but I clearly am not asking the correct question. I have trend data 2011 to 2022. My x axis is by year(numeric type) but the values come out as a decimal format and don’t align with my value. I’m guessing there is a way to set the break points, but I can’t seem to get the correct format.

image

I apologize I spoke to soon. I was able to find what I was looking for.
scale_x_discrete(limits = clean_fs$year) year is not a good column name which is why I have to reference my data set.

Now to try and fix my other issue.

Have a great day