Counts display on demographic pyramid

Hello,

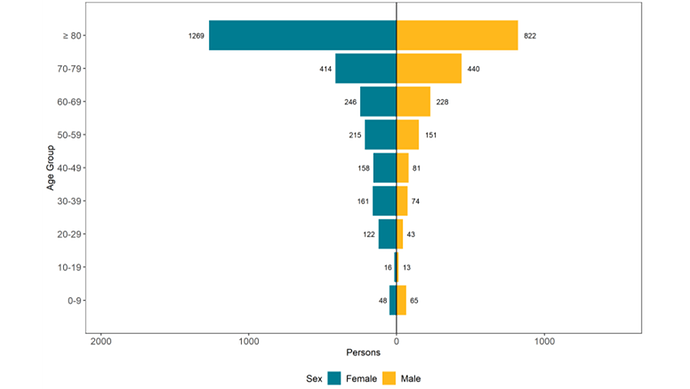
For my age-sex pyramid I want to display the counts next to the bars they correspond to but I’m not having much luck doing so.

My reprex is below, TIA!

pacman::p_load(epikit, apyramid, tidyverse)

pyramid_data <- data.frame(
  stringsAsFactors = FALSE,
      AGE_IN_YEARS = c(87L,75L,66L,1L,60L,65L,0L,
                       82L,37L,55L,83L,92L,95L,90L,86L,94L,80L,82L,
                       82L,64L,41L,76L,71L,61L,63L,0L,85L,70L,58L,87L,
                       65L,37L,66L,55L,50L,75L,15L,70L,95L,64L,87L,
                       92L,79L,81L,84L,92L,85L,90L,82L,66L,71L,1L,71L,
                       79L,79L,78L,0L,2L,85L,68L,84L,85L,79L,93L,
                       79L,78L,76L,70L,89L,61L,84L,89L,0L,80L,95L,71L,
                       70L,84L,61L,89L,59L,21L,35L,68L,0L,83L,95L,85L,
                       92L,76L,78L,58L,76L,87L,79L,80L,7L,32L,77L,
                       77L),
       PATIENT_SEX = c("Male","Female","Female",
                       "Female","Female","Male","Female","Male","Female",
                       "Female","Female","Male","Female","Male","Female",
                       "Male","Male","Female","Male","Female","Female","Male",
                       "Female","Female","Female","Male","Male","Male",
                       "Male","Male","Female","Female","Female","Male",
                       "Female","Male","Male","Male","Male","Female","Male",
                       "Male","Male","Male","Female","Female","Female",
                       "Female","Female","Male","Female","Female","Male","Male",
                       "Male","Female","Male","Female","Female","Female",
                       "Male","Male","Female","Female","Male","Male",
                       "Female","Female","Female","Male","Female","Female",
                       "Female","Female","Female","Male","Female","Male",
                       "Male","Female","Female","Female","Female","Female",
                       "Male","Male","Female","Male","Female","Male","Female",
                       "Female","Female","Male","Female","Male","Female",
                       "Male","Female","Female"),
           age_cat = as.factor(c("80+",
                                 "70-79","60-69","0-9","60-69","60-69","0-9",
                                 "80+","30-39","50-59","80+","80+","80+",
                                 "80+","80+","80+","80+","80+","80+","60-69",
                                 "40-49","70-79","70-79","60-69","60-69",
                                 "0-9","80+","70-79","50-59","80+","60-69",
                                 "30-39","60-69","50-59","50-59","70-79",
                                 "10-19","70-79","80+","60-69","80+","80+",
                                 "70-79","80+","80+","80+","80+","80+",
                                 "80+","60-69","70-79","0-9","70-79","70-79",
                                 "70-79","70-79","0-9","0-9","80+","60-69",
                                 "80+","80+","70-79","80+","70-79","70-79",
                                 "70-79","70-79","80+","60-69","80+",
                                 "80+","0-9","80+","80+","70-79","70-79","80+",
                                 "60-69","80+","50-59","20-29","30-39",
                                 "60-69","0-9","80+","80+","80+","80+",
                                 "70-79","70-79","50-59","70-79","80+","70-79",
                                 "80+","0-9","30-39","70-79","70-79"))
)


palette <- c("#007C91", "#FFB81C")

age_sex_pyramid <- age_pyramid(
  data = pyramid_data,
  age_group = age_cat,
  split_by = PATIENT_SEX,
  proportional = TRUE,
  show_midpoint = FALSE
) +
  geom_col(aes(fill = PATIENT_SEX), color = "white", position = "identity") +
  theme_classic() +
  scale_fill_manual(values = palette) +
  labs(
    title = "Age and sex of cases, for the past 4 weeks",
    x = "Age Group",
    y = "Proportion of all cases",
    fill = ""
  ) +
  theme(
    plot.title = element_text(color = "#007C91", size = 16, face = "bold", hjust = 0.5)
  )

Created on 2024-03-13 with reprex v2.1.0

Session info
sessionInfo()
#> R version 4.3.2 (2023-10-31 ucrt)
#> Platform: x86_64-w64-mingw32/x64 (64-bit)
#> Running under: Windows 10 x64 (build 19045)
#> 
#> Matrix products: default
#> 
#> 
#> locale:
#> [1] LC_COLLATE=English_United Kingdom.utf8 
#> [2] LC_CTYPE=English_United Kingdom.utf8   
#> [3] LC_MONETARY=English_United Kingdom.utf8
#> [4] LC_NUMERIC=C                           
#> [5] LC_TIME=English_United Kingdom.utf8    
#> 
#> time zone: Europe/London
#> tzcode source: internal
#> 
#> attached base packages:
#> [1] stats     graphics  grDevices utils     datasets  methods   base     
#> 
#> loaded via a namespace (and not attached):
#>  [1] digest_0.6.34     fastmap_1.1.1     xfun_0.42         glue_1.7.0       
#>  [5] knitr_1.45        htmltools_0.5.7   rmarkdown_2.25    lifecycle_1.0.4  
#>  [9] cli_3.6.2         reprex_2.1.0      withr_3.0.0       compiler_4.3.2   
#> [13] rstudioapi_0.15.0 tools_4.3.2       evaluate_0.23     yaml_2.3.8       
#> [17] rlang_1.1.3       fs_1.6.3
1 Like

Hello,

Are you trying to add a label for the counts? Your code is telling R to add the counts as bars to the plot, however, they will not be on the same scale as your age pyramid which you’ve requested proportions for. Once I know a bit more about your intentions, I can likely provide some code to help.

All the best,

Tim

Hi Tim!

I would like the chart to look like this essentially:

1 Like

Good morning,

Getting the label to work with the apyramid package is a bit difficult but I think the code below should work, essentially I am just setting the position of the label based on the value for the count:

# loading packages
library(tidyverse)
library(apyramid)

# creating fake data
pyramid_data <- data.frame(
  stringsAsFactors = FALSE,
  AGE_IN_YEARS = c(
    87L, 75L, 66L, 1L, 60L, 65L, 0L,
    82L, 37L, 55L, 83L, 92L, 95L, 90L, 86L, 94L, 80L, 82L,
    82L, 64L, 41L, 76L, 71L, 61L, 63L, 0L, 85L, 70L, 58L, 87L,
    65L, 37L, 66L, 55L, 50L, 75L, 15L, 70L, 95L, 64L, 87L,
    92L, 79L, 81L, 84L, 92L, 85L, 90L, 82L, 66L, 71L, 1L, 71L,
    79L, 79L, 78L, 0L, 2L, 85L, 68L, 84L, 85L, 79L, 93L,
    79L, 78L, 76L, 70L, 89L, 61L, 84L, 89L, 0L, 80L, 95L, 71L,
    70L, 84L, 61L, 89L, 59L, 21L, 35L, 68L, 0L, 83L, 95L, 85L,
    92L, 76L, 78L, 58L, 76L, 87L, 79L, 80L, 7L, 32L, 77L,
    77L
  ),
  PATIENT_SEX = c(
    "Male", "Female", "Female",
    "Female", "Female", "Male", "Female", "Male", "Female",
    "Female", "Female", "Male", "Female", "Male", "Female",
    "Male", "Male", "Female", "Male", "Female", "Female", "Male",
    "Female", "Female", "Female", "Male", "Male", "Male",
    "Male", "Male", "Female", "Female", "Female", "Male",
    "Female", "Male", "Male", "Male", "Male", "Female", "Male",
    "Male", "Male", "Male", "Female", "Female", "Female",
    "Female", "Female", "Male", "Female", "Female", "Male", "Male",
    "Male", "Female", "Male", "Female", "Female", "Female",
    "Male", "Male", "Female", "Female", "Male", "Male",
    "Female", "Female", "Female", "Male", "Female", "Female",
    "Female", "Female", "Female", "Male", "Female", "Male",
    "Male", "Female", "Female", "Female", "Female", "Female",
    "Male", "Male", "Female", "Male", "Female", "Male", "Female",
    "Female", "Female", "Male", "Female", "Male", "Female",
    "Male", "Female", "Female"
  ),
  age_cat = as.factor(c(
    "80+",
    "70-79", "60-69", "0-9", "60-69", "60-69", "0-9",
    "80+", "30-39", "50-59", "80+", "80+", "80+",
    "80+", "80+", "80+", "80+", "80+", "80+", "60-69",
    "40-49", "70-79", "70-79", "60-69", "60-69",
    "0-9", "80+", "70-79", "50-59", "80+", "60-69",
    "30-39", "60-69", "50-59", "50-59", "70-79",
    "10-19", "70-79", "80+", "60-69", "80+", "80+",
    "70-79", "80+", "80+", "80+", "80+", "80+",
    "80+", "60-69", "70-79", "0-9", "70-79", "70-79",
    "70-79", "70-79", "0-9", "0-9", "80+", "60-69",
    "80+", "80+", "70-79", "80+", "70-79", "70-79",
    "70-79", "70-79", "80+", "60-69", "80+",
    "80+", "0-9", "80+", "80+", "70-79", "70-79", "80+",
    "60-69", "80+", "50-59", "20-29", "30-39",
    "60-69", "0-9", "80+", "80+", "80+", "80+",
    "70-79", "70-79", "50-59", "70-79", "80+", "70-79",
    "80+", "0-9", "30-39", "70-79", "70-79"
  ))
)

# creating age pyramid
palette <- c("#007C91", "#FFB81C")

pyramid_data |>
  count(age_cat, PATIENT_SEX) |>
  age_pyramid(
    age_group = age_cat,
    split_by = PATIENT_SEX,
    count = n,
    show_midpoint = FALSE
  ) +
  geom_text(aes(y = if_else(n >= 0, n + 2, n - 2), label = abs(n))) +
  theme_classic() +
  scale_fill_manual(values = palette) +
  labs(
    title = "Age and sex of cases, for the past 4 weeks",
    x = "Age Group",
    y = "Proportion of all cases",
    fill = ""
  ) +
  theme(
    plot.title = element_text(color = "#007C91", size = 16, face = "bold", hjust = 0.5)
  )
#> Scale for fill is already present.
#> Adding another scale for fill, which will replace the existing scale.

Created on 2024-03-14 with reprex v2.1.0

Session info
sessioninfo::session_info()
#> ─ Session info ───────────────────────────────────────────────────────────────
#>  setting  value
#>  version  R version 4.3.1 (2023-06-16)
#>  os       macOS Ventura 13.6.3
#>  system   x86_64, darwin20
#>  ui       X11
#>  language (EN)
#>  collate  en_US.UTF-8
#>  ctype    en_US.UTF-8
#>  tz       America/Toronto
#>  date     2024-03-14
#>  pandoc   3.1.1 @ /Applications/RStudio.app/Contents/Resources/app/quarto/bin/tools/ (via rmarkdown)
#> 
#> ─ Packages ───────────────────────────────────────────────────────────────────
#>  package     * version date (UTC) lib source
#>  apyramid    * 0.1.3   2023-02-14 [1] RSPM (R 4.3.0)
#>  cli           3.6.2   2023-12-11 [1] CRAN (R 4.3.0)
#>  colorspace    2.1-0   2023-01-23 [1] CRAN (R 4.3.0)
#>  curl          5.2.0   2023-12-08 [1] CRAN (R 4.3.0)
#>  digest        0.6.34  2024-01-11 [1] RSPM (R 4.3.0)
#>  dplyr       * 1.1.4   2023-11-17 [1] CRAN (R 4.3.0)
#>  evaluate      0.23    2023-11-01 [1] CRAN (R 4.3.0)
#>  fansi         1.0.6   2023-12-08 [1] CRAN (R 4.3.0)
#>  farver        2.1.1   2022-07-06 [1] CRAN (R 4.3.0)
#>  fastmap       1.1.1   2023-02-24 [1] CRAN (R 4.3.0)
#>  forcats     * 1.0.0   2023-01-29 [1] CRAN (R 4.3.0)
#>  fs            1.6.3   2023-07-20 [1] CRAN (R 4.3.0)
#>  generics      0.1.3   2022-07-05 [1] CRAN (R 4.3.0)
#>  ggplot2     * 3.5.0   2024-02-23 [1] RSPM (R 4.3.0)
#>  glue          1.7.0   2024-01-09 [1] RSPM (R 4.3.0)
#>  gtable        0.3.4   2023-08-21 [1] CRAN (R 4.3.0)
#>  highr         0.10    2022-12-22 [1] CRAN (R 4.3.0)
#>  hms           1.1.3   2023-03-21 [1] CRAN (R 4.3.0)
#>  htmltools     0.5.7   2023-11-03 [1] CRAN (R 4.3.0)
#>  knitr         1.45    2023-10-30 [1] CRAN (R 4.3.0)
#>  lifecycle     1.0.4   2023-11-07 [1] CRAN (R 4.3.0)
#>  lubridate   * 1.9.3   2023-09-27 [1] CRAN (R 4.3.0)
#>  magrittr      2.0.3   2022-03-30 [1] CRAN (R 4.3.0)
#>  munsell       0.5.0   2018-06-12 [1] CRAN (R 4.3.0)
#>  pillar        1.9.0   2023-03-22 [1] CRAN (R 4.3.0)
#>  pkgconfig     2.0.3   2019-09-22 [1] CRAN (R 4.3.0)
#>  purrr       * 1.0.2   2023-08-10 [1] CRAN (R 4.3.0)
#>  R.cache       0.16.0  2022-07-21 [1] CRAN (R 4.3.0)
#>  R.methodsS3   1.8.2   2022-06-13 [1] CRAN (R 4.3.0)
#>  R.oo          1.26.0  2024-01-24 [1] RSPM (R 4.3.0)
#>  R.utils       2.12.3  2023-11-18 [1] CRAN (R 4.3.0)
#>  R6            2.5.1   2021-08-19 [1] CRAN (R 4.3.0)
#>  readr       * 2.1.5   2024-01-10 [1] RSPM (R 4.3.0)
#>  reprex        2.1.0   2024-01-11 [1] RSPM (R 4.3.0)
#>  rlang         1.1.3   2024-01-10 [1] RSPM (R 4.3.0)
#>  rmarkdown     2.25    2023-09-18 [1] CRAN (R 4.3.0)
#>  rstudioapi    0.15.0  2023-07-07 [1] CRAN (R 4.3.0)
#>  scales        1.3.0   2023-11-28 [1] CRAN (R 4.3.0)
#>  sessioninfo   1.2.2   2021-12-06 [1] CRAN (R 4.3.0)
#>  stringi       1.8.3   2023-12-11 [1] CRAN (R 4.3.0)
#>  stringr     * 1.5.1   2023-11-14 [1] CRAN (R 4.3.0)
#>  styler        1.10.2  2023-08-29 [1] CRAN (R 4.3.0)
#>  tibble      * 3.2.1   2023-03-20 [1] CRAN (R 4.3.0)
#>  tidyr       * 1.3.1   2024-01-24 [1] RSPM (R 4.3.0)
#>  tidyselect    1.2.0   2022-10-10 [1] CRAN (R 4.3.0)
#>  tidyverse   * 2.0.0   2023-02-22 [1] CRAN (R 4.3.0)
#>  timechange    0.3.0   2024-01-18 [1] RSPM (R 4.3.0)
#>  tzdb          0.4.0   2023-05-12 [1] CRAN (R 4.3.0)
#>  utf8          1.2.4   2023-10-22 [1] CRAN (R 4.3.0)
#>  vctrs         0.6.5   2023-12-01 [1] CRAN (R 4.3.0)
#>  withr         3.0.0   2024-01-16 [1] RSPM (R 4.3.0)
#>  xfun          0.42    2024-02-08 [1] RSPM (R 4.3.0)
#>  xml2          1.3.6   2023-12-04 [1] CRAN (R 4.3.0)
#>  yaml          2.3.8   2023-12-11 [1] CRAN (R 4.3.0)
#> 
#>  [1] /Users/timothychisamore/Library/R/x86_64/4.3/library
#>  [2] /Library/Frameworks/R.framework/Versions/4.3-x86_64/Resources/library
#> 
#> ──────────────────────────────────────────────────────────────────────────────

All the best,

Tim

Thank you Tim you’ve helped me a lot!

1 Like