Hi @finlaycampbell - thanks so much! Please find a reproducible example below. Next to the plot function I have made comments of commands that aren’t working for me. If you are able to help, these are the functions I would like to be able to change on the transmission chain:
- Arrows to appear between nodes
- Set the position of unlinked nodes (top or bottom)
- Have transmission lines be fixed straight
- Show the legend in two columns and set font size of legend text
#install and load packages
pacman::p_load(rio, here, tidyverse, remotes, visNetwork, epicontacts)
#generate data sample
demodata <- data.frame(
stringsAsFactors = FALSE,
case_id = c(1:40),
date_onset = c("2019-05-01", "2019-05-05", "2019-05-08", "2019-05-23"),
species = c("test_1", "test_2", "test_3", "test_4", "other"),
infector_1 = c("3", "1", "1", "1", "4", "1", "4", "7", "8", "3", NA, "1", "10", "5", "11",
NA, NA, NA, NA, NA, "40", "40", NA, NA, NA, NA, NA,"30", "27", NA,
"33", NA, "28", NA, "34", "19", "38", "37", NA, "3" ),
contact_type = c("Direct", "Direct", "Indirect", "Indirect", "Direct"))
#change date class
demodata <- demodata %>%
mutate(date_onset = as.Date(date_onset))
#Change to factors and make labels
demodata$species <- factor(demodata$species, labels = c("Test 1",
"Test 2",
"Test 3",
"Test 4",
"Other"))
demodata$contact_type <- factor(demodata$contact_type)
#Generate contacts ####
contacts <- demodata %>%
transmute(
infector = infector_1,
case_id = case_id,
location = contact_type,
date_onset = date_onset
) %>%
drop_na(infector)
#Generate epicontacts object ####
epic <- make_epicontacts(
linelist = demodata,
contacts = contacts,
id = "case_id",
from = "infector",
to = "case_id",
directed = TRUE
)
#colour palette for nodes
mycols <- c(
`Test 1` = "#440154",
`Test 2` = "#3b528b",
`Test 3` = "#5ec962",
`Test 4` = "#fde725",
Other = "grey")
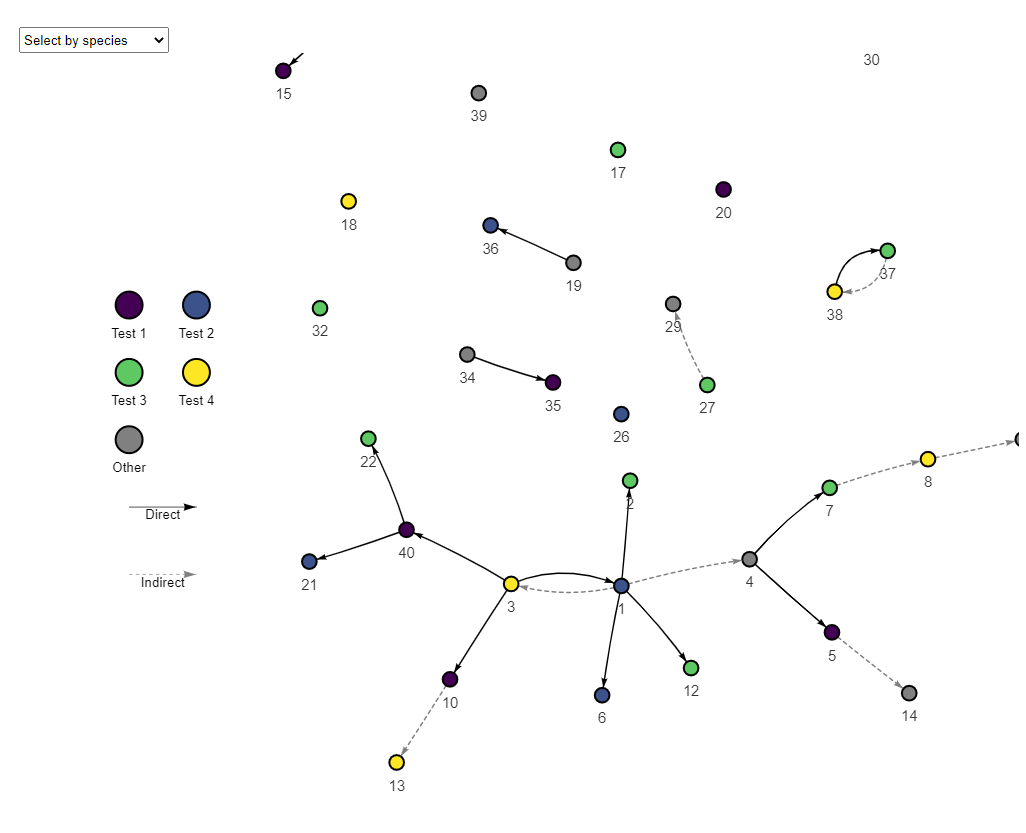
#plot the transmission chain ####
plot(
epic,
x_axis = NULL,
node_color = "species",
node_size = 10,
col_pal = mycols,
thin = FALSE,
label = "id",
unlinked_pos = "top", #not working - position of unlinked nodes
edge_flex = FALSE, #not working - edges to remain straight when moved
edge_color = 'location',
edge_col_pal = c(Direct = "black", Indirect = "grey"),
edge_linetype = 'location',
edge_width = 2,
font_size = 20,
arrow_size = 0.5, #not working - no arrows showing
legend = TRUE,
legend_ncol = 2, #not working - show legend in two columns
height = 800,
width = 1000
)