Hi.
This is the first time I am posting here.
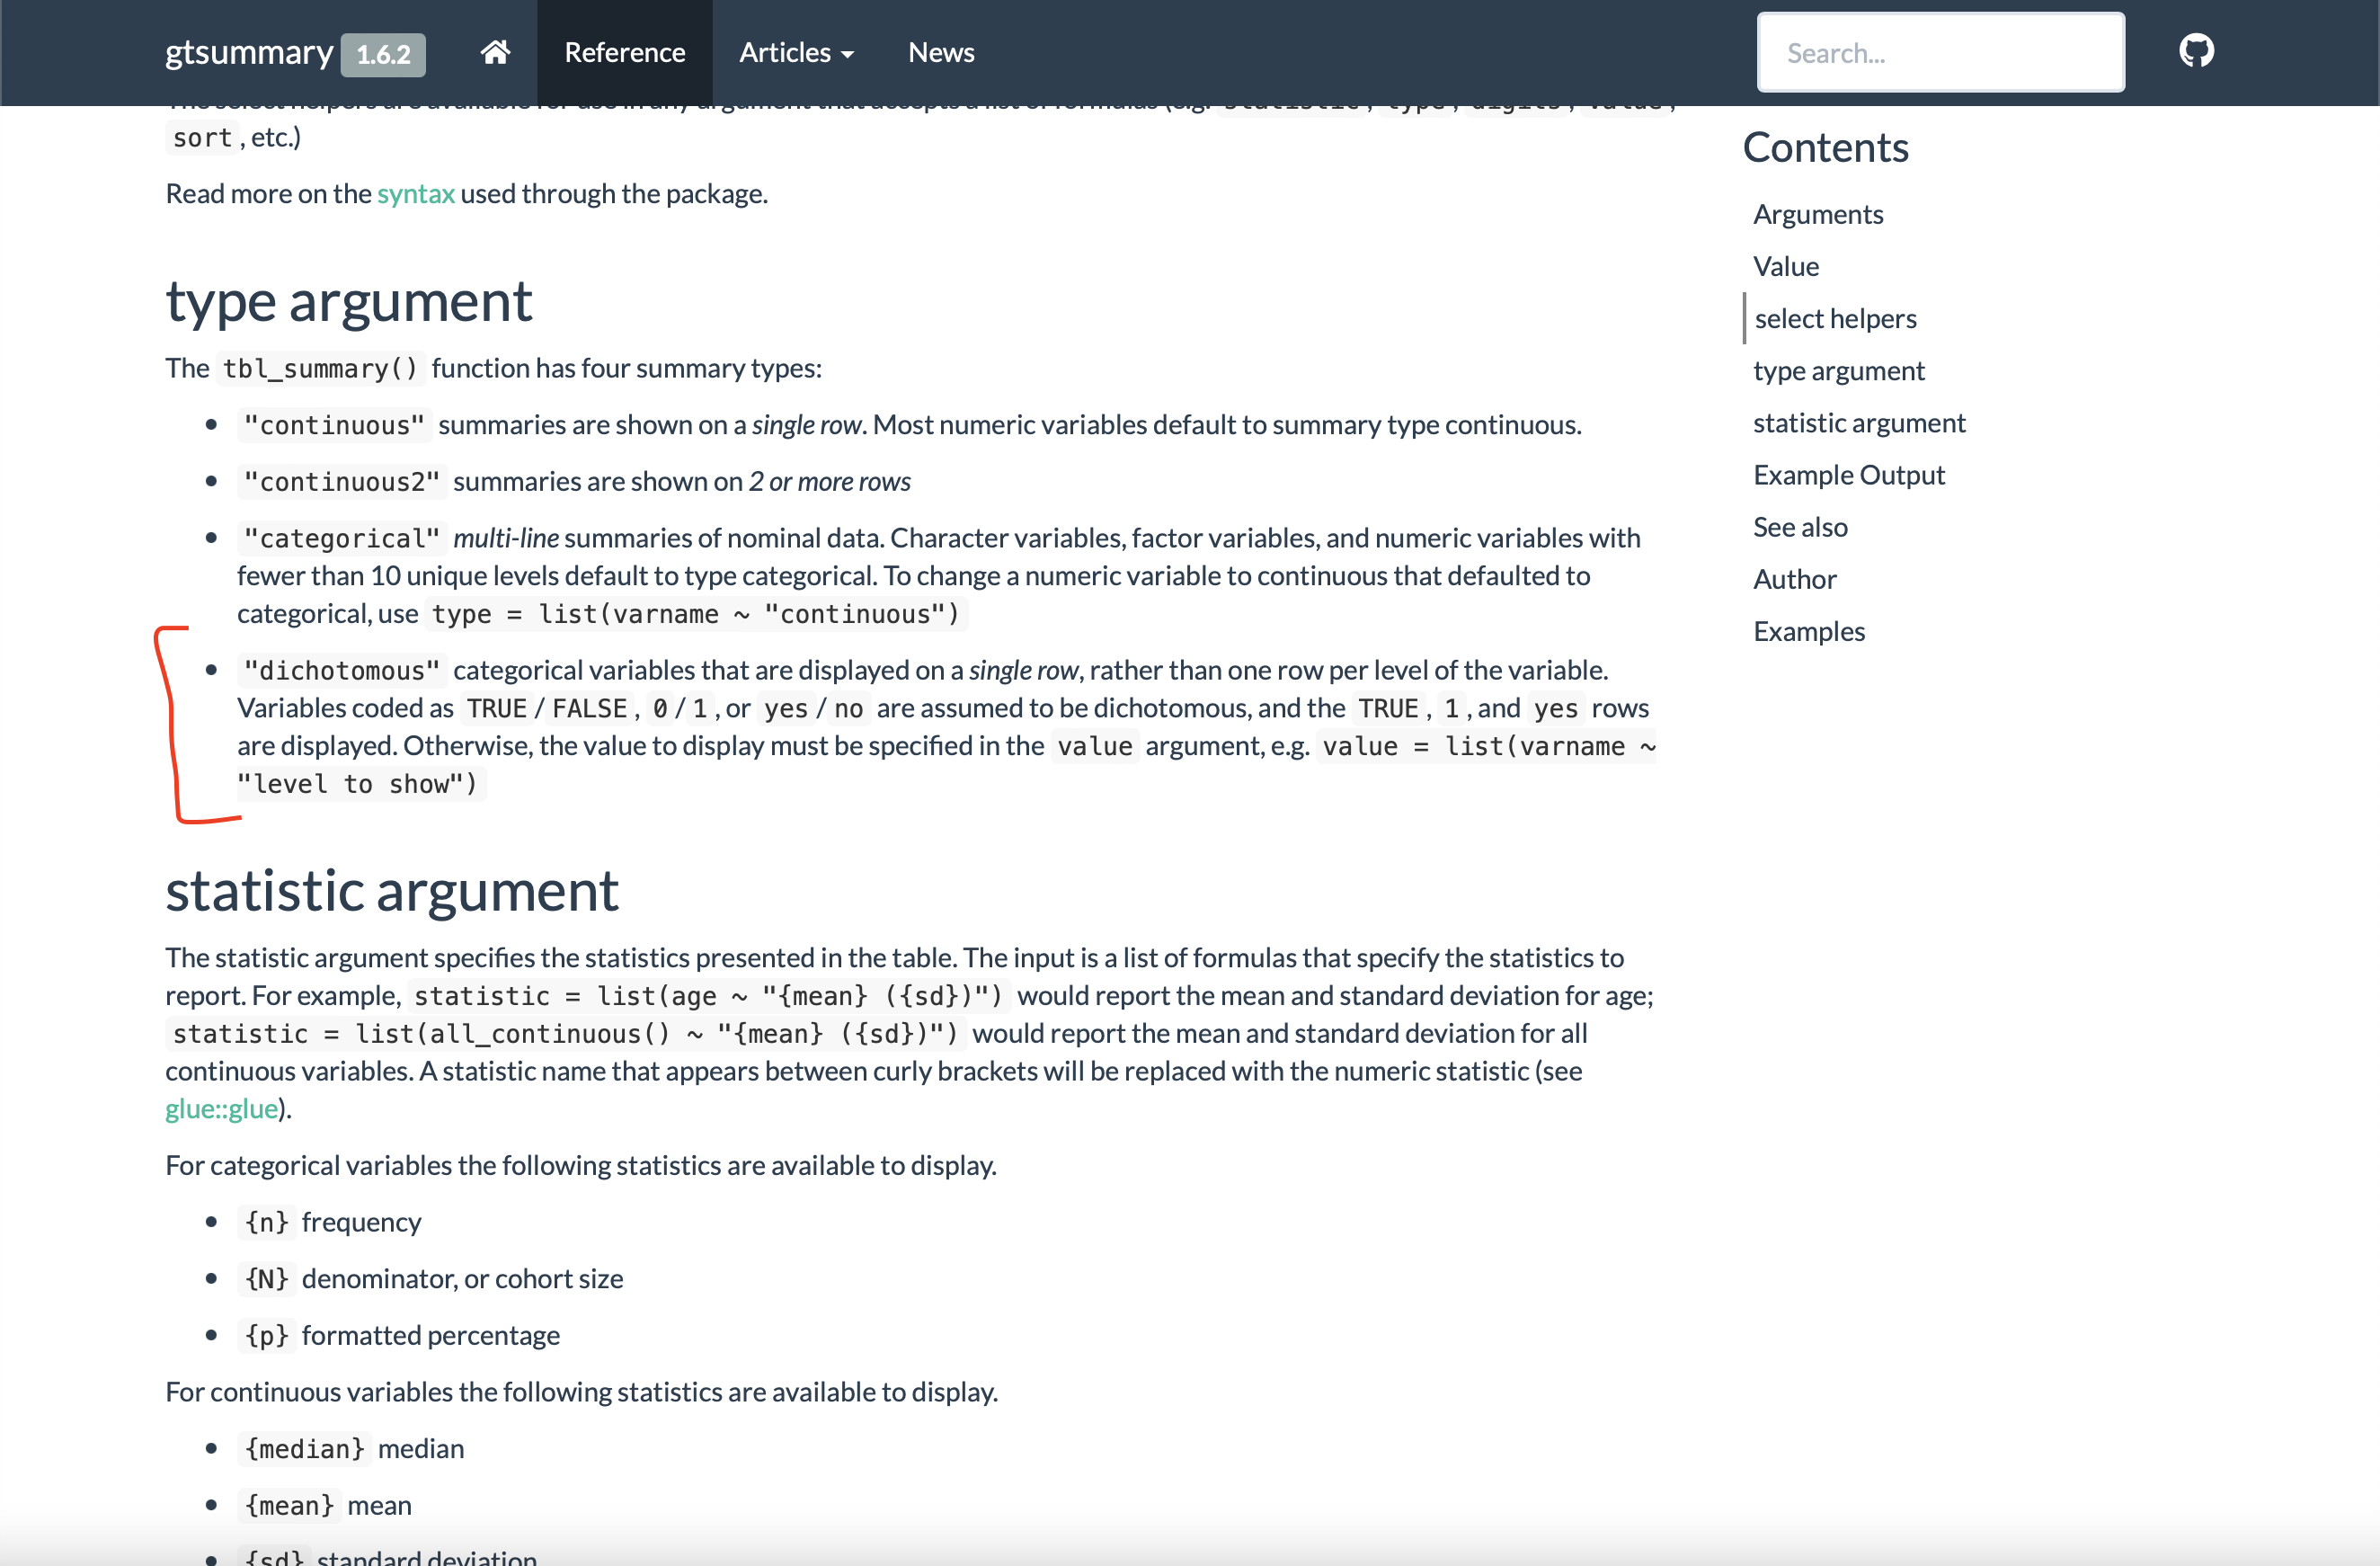
I have a dataset with multiple multi-select variables which show values of resposes as 0s and 1s. I don’t want to change the 0s and 1s in my dataset, but I have a challenge, only the 1s (Yes) values showed in my table when I used tbl_summary() {gt_summary} for the univariate analysis. Please how can I fix this?
I even tried looking for how I can create new columns and mutate across the multiple columns to rename the 0s and 1s to yes and no in my dataset, but I couldn’t find a way.
tba %>%
select(
barriers_ser_trans,
barriers_ser_afdt,
barriers_ser_loc,
barriers_ser_inadtim,
barriers_ser_dmkrabs,
barriers_ser_dmkrnta,
barriers_ser_tbaper,
barriers_ser_tbasc,
barriers_ser_tbaps,
barriers_ser_others,
barriers_ser_norms,
state) %>%
tbl_summary(
by = state,
percent = “column”,
label = list(
barriers_ser_trans ~ “Lack of Transport Means”,
barriers_ser_afdt ~ “Unaffordability of Transportation”,
barriers_ser_loc ~ “Inability to Locate the Target Household”,
barriers_ser_inadtim ~ “inadequate Time to Reach Households”,
barriers_ser_dmkrabs ~ “Decision Maker not Present”,
barriers_ser_dmkrnta ~ “Decision Maker did not Allow”,
barriers_ser_tbaper ~ “TBA Needs Permission to Travel”,
barriers_ser_tbasc ~ “Security Concerns by TBA Household”,
barriers_ser_tbaps ~ “TBAs Concern for Own Personal Health”,
barriers_ser_others ~ “Others”,
barriers_ser_norms ~ “Sociocultural Norms”),
missing = “ifany”,
missing_text = “No Response”)%>%
modify_caption(“Barriers to TBAs Providing Services”) %>%
italicize_labels() %>%
italicize_levels() %>%
bold_labels() %>%
modify_header(label ~ “Variable”) %>%
modify_spanning_header(c(“stat_1”, “stat_2”) ~ “Number of TBAs”) %>%
add_overall() %>%
modify_footnote(
all_stat_cols() ~ “Frequency (%)”)
Output looks like this
Variable Frequency(%)
Lack of Transport Means 225(%)
Unaffordability of Transportation 135(%)
I want it to look like this
Variable Frequency(%)
Lack of Transport Means
Yes 225(%)
No 334(%)
Unaffordability of Transportation
Yes 135(%)
No 424(%)
Please pardon the mess. I skipped the additional reading on creating examples, I will study that soon. Thank you.