Calculating person-days

Dear All.

I am contacting you from Slovenia.

We have a challenge we stumbled upon while planning our research, namely we want to calculate person-days in R for oncological patients vaccinated against covid and then observe the outcome - confirmed SARS-CoV-2 infection.

We have an Excel document with date of vaccination(s) and date of confirmed infection (or no infection) for about 5000 oncological patients in 2021. Our main goal is to calculate a more precise vaccine effectiveness using the person-days unit.

Is there any possibility you could help us with an R package that could calculate that? We are very new to R and are still learning the beginner steps however we are in a bit of a time rush to finish the above mentioned work.

I thank you in advance for your answer and am available for any further clarifications. Any help will be highly appreciated.

Kind regards,

-Sanja Vuzem

1 Like

Hello Sanja,

I think you will need to provide us with more information regarding what exactly you want to calculate. As well, providing simulated or fake data would be very beneficial.

All the best,

Tim

Hello Sanja,

You can see this post for guidance on how to provide us with just a small portion of your dataset (anonymized), in a manner that we can help you.

Neale

1 Like

Hello R geniuses. :blush:

Uploaded you can find our sample Excel sheet with anonymized data. Please find a detailed explanation below. (UPDATE: I could not upload an Excel file, so I went step-by-step following your instructions, hopefully I did it right, please see end of post :see_no_evil:).

We have patients we were following throughout a period of time. Some entered our research sooner, others later. The inclusive criteria was date of cancer diagnosis.

Then these patients either got vaccinated against COVID-19 or they didn’t. They also got diagnosed with COVID-19 or they didn’t. Same goes for hospitalization.

So the trick that we want to solve with R: we want to calculate person-days but we have different starting points and ending points for each patient. We were able to generally shape seven different groups of observation periods (to calculate person-days):

  • Vaccinated ( Date_fully_vaccinated ) → Not diagnosed ( End_date_not_diagnosed )
  • Vaccinated ( Date_fully_vaccinated ) → Diagnosed ( Date_covid_diagnosis )
  • Vaccinated ( Date_fully_vaccinated ) → Died ( Death (date) )
  • Not vaccinated ( Date_cancer_diagnosis ) → Not diagnosed ( End_date_not_diagnosed )
  • Not vaccinated ( Date_cancer_diagnosis ) → Diagnosed ( Date_covid_diagnosis )
  • Not vaccinated ( Date_cancer_diagnosis ) → Died ( Death (date) )
  • Not vaccinated ( Date_cancer_diagnosis ) → Fully vaccinated ( Date_fully_vaccinated )

For those not diagnosed we decided on the same end-point observation date (27/9/2022) – this is the day we ended our observation period.

Our main goal is to calculate vaccine effectiveness (VE) for two different outcomes – SARS-CoV-2 infection and COVID-19 SARI hospitalization.

We will use the formula VE = (1 – RR) * 100 to calculate VE. But to get the RR numbers we need the person-days denominator.

To calculate RR for SARS-CoV-2 infection (and after for hospitalization) we will use the formula:

image

We would first like to calculate the overall VE (for the entire period of observation), hence we would need the overall person-days for the above mentioned groups. If you could help us just with this, we would be immensely grateful.

Our next step (if all would go well with the overall VE calculations) would be to try to compare VE for different time periods after vaccination:

  • 0-3 months after
  • 3-6 months after
  • 6-9 months after
  • 9-12 months after.

However, this would be a second step.

We really look forward to finding a solution with your help.
If you need additional info, please let me know.

Thank you, thank you, thank you.

-Sanja

A tibble: 49 × 10

ID Sex Age Date_cancer_diagnosis Date_fully_vaccinated Date_covid_diagnosis End_date_…¹ Date_…² End_d…³ Death…⁴

1 MM1 M 0 2021-01-06 NA 2022-08-13 NA NA 27/09/… NA
2 MM2 M 4 2021-12-07 NA 2022-03-14 NA NA 27/09/… NA
3 MM3 M 6 2021-08-23 2022-01-10 2021-02-02 NA NA 27/09/… NA
4 MM4 F 7 2021-07-27 NA NA 27/09/2022 NA 27/09/… NA
5 MM5 M 11 2021-03-11 NA 2021-05-05 NA NA 27/09/… NA
6 MM6 M 11 2021-08-12 NA NA NA NA NA 2022-0…
7 MM7 M 13 2021-12-31 2021-10-21 2021-12-06 NA NA 27/09/… NA
8 MM8 F 13 2021-10-19 NA NA 27/09/2022 NA 27/09/… NA
9 MM9 M 15 2021-11-19 NA 2022-01-29 NA NA 27/09/… NA
10 MM10 F 16 2021-01-29 2021-08-23 NA 27/09/2022 NA 27/09/… NA

… with 39 more rows, and abbreviated variable names ¹​End_date_not_diagnosed, ²​Date_hospitalisation,

³​End_date_hospitalisation, ⁴​Death…date.

:information_source: Use print(n = ...) to see more rows

Hello Sanja,

If I am interpreting your question correctly, it sounds like you will need to use survival analysis for this. Specifically, it sounds like COVID-19 diagnosis is your outcome and COVID-19 vaccination status is your predictor. Further, you are right-censoring using 2022-09-27 as the final date for follow-up, though, I would consider death as censoring as well, assuming it was not due to COVID-19.

Another issue you will have to contend with this is the potential for immortal time bias since the date of full vaccination seems to exceed the cancer diagnosis date so I would recommend measuring the time to event with respect to the full vaccination date rather than the date of cancer diagnosis.

I would begin by creating an indicator for infection status and an indicator for censoring (this will include cases that died prior to being diagnosed with COVID-19). Finally, you will then need to derive the time to event.

Here is some R code to demonstrate how you could do this, but I was unable to use your data since the field names and data itself did not display.

library(tidyverse)

fake_data |>
	mutate(
		is_vaccinated = if_else(
			condition = !is.na(date_fully_vaccinated),
			true = TRUE,
			false = FALSE
		),
		# indicator for whether the individual was diagnosed with COVID-19
		is_infected = if_else(
			condition = !is.na(date_covid_diagnosis),
			true = TRUE,
			false = FALSE
		),
		# indicator for whether the individual died, we need this to calculate
		# follow-up separately when an individual died prior to diagnosis
		is_dead = if_else(
			condition = !is.na(date_of_death),
			true = TRUE,
			false = FALSE
		),
		# indicator for whether the individual was censored
		# this could include those who did not have COVID-19 by the end of
		# observation or those who died prior to diagnosis of COVID-19
		is_censored = !is_infected,
		days_of_follow_up = case_when(
			(is_vaccinated & is_infected) ~ lubridate::time_length(
				x = lubridate::interval(
					start = lubridate::ymd(date_fully_vaccinated),
					end = lubridate::ymd(date_covid_diagnosis)
				),
				unit = "days"
			),
			(is_vaccinated &
			 	!is_infected & is_dead) ~ lubridate::time_length(
			 		x = lubridate::interval(
			 			start = lubridate::ymd(date_fully_vaccinated),
			 			end = lubridate::ymd(date_of_death)
			 		),
			 		unit = "days"
			 	),
			(is_vaccinated &
			 	!is_infected & !is_dead) ~ lubridate::time_length(
			 		x = lubridate::interval(
			 			start = lubridate::ymd(date_fully_vaccinated),
			 			end = lubridate::ymd("2022-09-27")
			 		),
			 		unit = "days"
			 	),
			(!is_vaccinated & is_infected) ~ lubridate::time_length(
				x = lubridate::interval(
					start = lubridate::ymd(date_cancer_diagnosis),
					end = lubridate::ymd(date_covid_diagnosis)
				),
				unit = "days"
			),
			(!is_vaccinated &
			 	!is_infected & is_dead) ~ lubridate::time_length(
			 		x = lubridate::interval(
			 			start = lubridate::ymd(date_cancer_diagnosis),
			 			end = lubridate::ymd(date_of_death)
			 		),
			 		unit = "days"
			 	),
			(!is_vaccinated &
			 	!is_infected & !is_dead) ~ lubridate::time_length(
			 		x = lubridate::interval(
			 			start = lubridate::ymd(date_cancer_diagnosis),
			 			end = lubridate::ymd("2022-09-27")
			 		),
			 		unit = "days"
			 	)
		)
	)

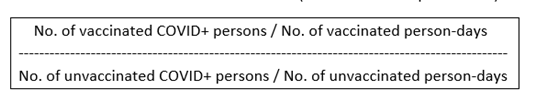
Once you have the data in the right format, you can then use survival analysis techniques to calculate the cumulative incidence/hazard and thus the relative risks.

EDIT: I forgot to mention, you should likely also add some buffer to the date of full vaccination as an individual will not be immune instantaneously. Rather, there is probably some length of time after this date where a diagnosis should be attributed to the non-vaccinated stratum. You would need to find this from literature if you haven’t done so already.

All the best,

Tim

1 Like

Here is the chapter in the Epidemiologist R Handbook on Survival Analysis

1 Like

Hi Sanja

It sounds like you want to be using our functions from the epikit package.

To do this you create two variables in your data set, one for the minimum possible date and one for the maximum possible date in your observation period.
Once you have those you can tell the functions which variables to consider as the individual’s possible start and end dates. It then creates variables to tell you the date that was taken and the variable which that date was taken from.
Once you have a start and an end date, you just calculate the difference in days between those two.

This was originally developed for doing mortality surveys - but the same principle applies to your scenario.
There is a more detailed walkthrough of the code here

Hope this helps
Alex

1 Like