Breaks in map in r

Greetings
I am facing an issue in shape map breaks
I want the legend looks like:

  1. Zero white color
    0.1 - 9.9
    10-99.9
    100+ dark color
cimap <- ggplot2::ggplot(district) + 
  geom_sf(mapping = aes(fill = Incidence), 
          colour = "black", 
          size = 0.5) +
  coord_sf() + 
  scale_fill_distiller(palette ="YlGnBu", 
                       labels = c("Zero", "0.1-9.9", "10-99.9","100+"),
                       breaks = c(0,10,100,Inf),
                       direction = 1) +
  guides(fill = guide_legend(title = "Incidence per 100 000", 
                             reverse = FALSE)) + 
  theme_nothing(legend = TRUE)


cimap

Any suggestions
thank you

1 Like

Hi,
If you are trying to keep a continuous scale and just show these breaks the code you have should work fine. In terms of your labels and breaks, these do not align, with the current setup anything 0-10 will be in the first bin, 10-100 in the second etc. If you want 0-0.1 to be a bin to itself you will need c(0,0.1,10,100). The top Inf break is not required. i.e.:

   scale_fill_distiller(palette ="YlGnBu", 
                     labels = c("Zero", "0.1-9.9", "10-99.9","100+"),
                      breaks = c(0, 0.1,10,100),
                       direction = 1) 

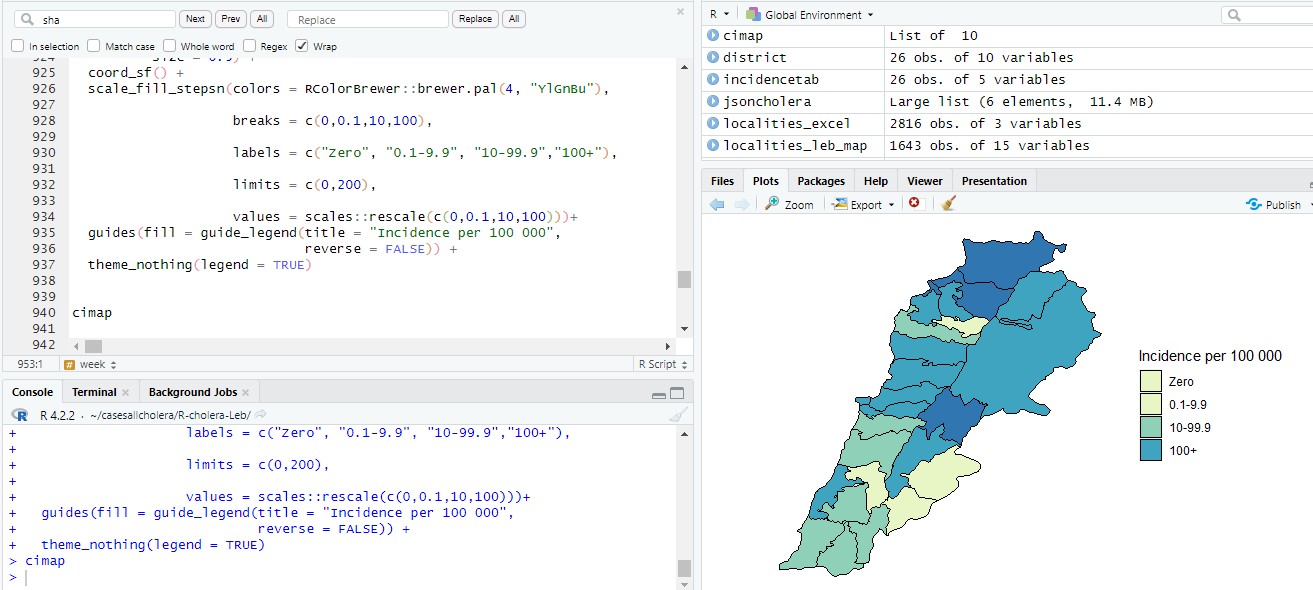
If you are trying to set fixed colours for each of these groups this is a little more complex but will give a cleaner result. You will need to bin your colour scale as well as your data. We can do this with scale_fill_stepsn(). e.g.:

  scale_fill_stepsn(colors = RColorBrewer::brewer.pal(4, "YlGnBu"),
                 breaks = c(0,0.1,10,100), 
                 labels = c("Zero", "0.1-9.9", "10-99.9","100+"), 
                 values = scales::rescale(c(0,0.1,10,100)))

To customise the brewer palette I think you still need to install the old package RColorBrewer to access the palette files (the RColorBrewer::brewer.pal() above).

You will also see that I use the “values” argument to scale the palette so it covers the full depth of available colours, if you remove this you will see that 0 and 0.1-9.9 have very similar colours as they are numerically similar.

If your data do not cover the whole range of the breaks you will get errors like this: ! `breaks` and `labels` are different lengths, you can fix this by setting limits outside of your data range:

  scale_fill_stepsn(colors = RColorBrewer::brewer.pal(4, "YlGnBu"),
                 breaks = c(0,0.1,10,100), 
                 labels = c("Zero", "0.1-9.9", "10-99.9","100+"), 
                 limits = c(0,200),
                 values = scales::rescale(c(0,0.1,10,100)))

Hope this helps,
David

If this is not the issue you are trying to fix please try and provide error messages and a reproducible example like this

2 Likes

Thank you for your helpful answer
its working and its showing the colors level on map but in legend its still showing “zero” and “0.1-10” with same color and 100+ showed <100 color and the >100 is not appear.

1 Like

Interesting!
It seems like guides() is overwriting the legend when you use it to set the title. You can try setting a title like this instead and removing the guides(fill=...):

  scale_fill_stepsn(colors = RColorBrewer::brewer.pal(4, "YlGnBu"),
                    breaks = c(0,0.1,10,100), 
                    labels = c("Zero", "0.1-9.9", "10-99.9","100+"), 
                    limits = c(0,200),
                    values = scales::rescale(c(0,0.1,10,100)),
                    name = "Incidence per 100 000")

That works as expected for me but not sure what the root cause is…
Best,
David

1 Like

Worked out it is because the guide is called guide_coloursteps() rather than guide_legend() for a binned plot like this.

If you want to use a discrete legend I think you will need to either 1) hack it together, 2) specify the 4 colours directly in scale_fill_stepsn rather than pulling from the palette so you don’t need to rescale the values (probably easiest) or 3) create a discrete variable to plot.
Some info here:

1 Like